Gen I Capture RNG Mechanics
Special thanks to TiKevin83, the Pokémon Speedruns Discord, and this article on Glitch City Laboratories, which beat me to covering this.
Capturing in Red, Blue and Yellow is fascinating just in how differently it's designed from the later games - but in addition to the way the actual capture algorithm is designed, the games' random number generator adds a delightful additional layer of weirdness. This page will explain how the random number generator works, the implications of this, and give some cool visualizations to play with to get a grasp on why it works the way it does. It's going to get a bit technical, and I won't claim it will be a light read, but the explanation is meant to be reasonably understandable for a layman - so don't worry if you don't know much about math or computer science! I won't assume you know any specialized terminology or are familiar with advanced mathematics.
This article will assume that you already understand how the capture algorithm works; please refer to the R/B/Y capture mechanics page if you're confused.
If all you want to do is find out how likely you are to capture a Pokémon in R/B/Y, you'll want the catch rate calculator.
How the RNG Works
Computers can't quite produce true randomness - everything that a computer does is fundamentally deterministic, where the same initial state and same calculation will always give the same result. When computers want to simulate chance events such as dice rolls, they generally need to resort to a pseudo-random number generator, some sort of clever algorithm that produces numbers that appear and behave as if they were completely random, even if they aren't exactly. Just about all video games with any kind of randomness or chance element use some kind of pseudo-random number generator - when people speak of random number generators or RNG in video games, it's really pseudo-randomness. Depending on exactly how a given random number generator works, there may be exploits or irregularities to it, compared to if it were genuinely random.
While many pseudo-random number generators use clever mathematical formulas, the random number generator used in the first-generation Pokémon games is actually a very simple one. There are only three things you need to know about the game's internals to understand how it works:
- There is a number in the game's memory called the divider register (rDiv), which increments rapidly from 0 through 255, then back to 0 and so on, continuously while the game is played. More specifically, it is incremented by one every 256 processor cycles. You can treat processor cycles more or less like a unit of time for our purposes; any given operation or calculation the console performs takes some fixed number of processor cycles, so if some operation or series of operations takes 512 processor cycles to perform, the divider register will have incremented twice when it's done. Processor cycles are extremely fast: even on an old rickety console like the Game Boy, the divider register is incremented more than 16,000 times a second.
- The carry bit is a single bit (zero or one) that is set based on the outcome of certain arithmetic operations performed by the processor - it's essentially the same kind of "carrying the one" that you probably learned to do in grade school math, but the details are not terribly important here, only the fact it's sometimes zero and sometimes one depending on whatever the last thing the game was doing was.
- The random number generator works with two values, also stored in the game's memory, which are only changed by the random number generator; that is, they will keep whatever value it sets them to until the next time the game generates a random number. I'll refer to these two values here as the add byte and the subtract byte, for reasons that are about to become clearer. (A byte is a set of eight bits, which can represent numbers from 0 to 255.)
When the game wants to generate a random number, it will:
- Add the current rDiv value and the current carry bit (as set by whatever the last calculation performed was) to the value of the add byte; if the outcome surpasses 255, it will simply loop around to count from zero, so that e.g. 255 + 2 = 1.
- Subtract the current rDiv value and the current carry bit (which will have been set by the addition in the previous step - if the addition caused the add byte's value to overflow past 255, the carry bit will be 1, while otherwise it will be 0) from the subtract byte; again, if this takes us down past zero, we start counting backwards starting from 255, so that 1 - 2 = 255.
And that's it - the add byte and the subtract byte are your pseudo-random numbers. The game will run the random number generator (i.e. add to the add byte and subtract from the subtract byte as outlined above) not only when it needs a random number, but also for good measure once on every frame - sixty times a second. When it needs a random number for some calculation, it will run this random number generator routine, then grab either just the add byte value (when it only needs a single random byte) or both the add and subtract bytes (when it needs two). As it happens both of the random numbers generated for the capture algorithm are single bytes and they're generated separately, so they both only use the add byte; for the purposes of this page, we will ignore the subtract byte from here on and just talk about the add byte value as the generated random number.
With me so far? To take a clarifying example: suppose the game wants a single random byte. The current value of the rDiv register is 12, the carry bit is 1, and the current value of the random add byte is 123. To get its "random" number, the game will simply add 12 + 1 to the add byte, resulting in 136, and then use 136 as the random number. That's really all there is to it, for our purposes.
This doesn't sound very random at all, but it actually works pretty well when just generating one or two single bytes for some calculation: it will generate an even distribution of all possible values between 0 and 255 (that is, it's equally likely to be any of those numbers), and even if you've just generated one number, since the next one depends on the current value of the rapidly-changing divider register, the next number is still equally likely to be any of the other numbers between 0 and 255. By the time you need a random number for a different calculation - on the next turn of a battle, etc. - all these values will be something entirely different that you couldn't predict, since they change so rapidly: not only will rDiv probably have run hundreds of loops all the way from 0–255 and might have landed on any number, we've also called the random number generator dozens of times in between. The programmers were probably thinking along these lines when they programmed the RNG in this way.
A potential problem, however, arises when you generate three or more random numbers for a single calculation. Hypothetically, if you generate a single random number and it's 123, and then you immediately generate another one with a carry of 1 which is 136 - well, that means the rDiv value was 12, which means that if you then generate a third number with no carry, it's going to be 148, or maybe 149 if it just so happens that rDiv was incremented to 13 in the interim. These three numbers are correlated - knowing the first two basically tells you what the third is going to be - even though just the first two on their own weren't.
This correlatedness even applies if you don't generate the third number quite immediately, too - so long as it's all part of the same calculation that's being executed without interruption, you can in principle know exactly what the game will be doing between the two random calls, which means you can determine the number of processor cycles it takes, and thus approximately how much the rDiv value will have changed in the interim. For instance, if in the example above we don't generate the third number until exactly 12800 processor cycles after the second - exactly the time it takes the rDiv register to increment fifty times - well, then the rDiv value will have been incremented to 62 by the time we generate the third number, so the third number will be 198. It's still deterministically correlated.
Why This Matters for Capturing
If you've been paying attention and read the capture mechanics page, you might protest, Okay, but the capture algorithm only involves two random numbers! So if it's only a problem with three or more, why is it an issue here?
Well - notice how the random number generator as described above doesn't have any provisions for generating from a particular range of numbers? It's just a couple of pseudo-random bytes, which can take any value from 0–255. So how does the game handle generating the R1 number, which has a different range depending on the ball you're using?
What it actually does is simply to run the random number generator, and then if the resulting value is not within the range it wants, it tries again until it is. This method, known as rejection sampling (because it just rejects values that don't fit the bill) would by itself be a reasonable way to do this with a hypothetical true random number generator - but combined with the mechanics of this RNG, it spells trouble. If we reroll R1, then suddenly we might be dealing with three random numbers generated within this calculation (or even more, with more rerolls), which will be correlated as explained above and lead to skewed results.
Essentially, when you throw a ball, there are four main possibilities for what will happen, RNG-wise:
- The first random number generated for R1 happens to be less than B (the ball modifier). This means we stop there, and if we get to the step of generating R2, it will be completely random and uncorrelated as expected. The capture algorithm will work exactly as intended. This will always happen if you're using a Poké Ball, because then B is 256 - the full range of random numbers is allowed, and we never reroll. Otherwise, the odds of this are B/256, i.e. 201/256 for Great Balls and 151/256 for Ultra/Safari Balls.
- The first random number is greater than or equal to B; then, when we reroll, we do get something less than B, but it doesn't fall within the capture rate window (refer to the main capture mechanics page), and thus we never have to generate an R2. Even though we had to reroll, we don't actually end up generating a third number, so the two numbers that we did generate still have equal odds of being any number as they should, and the algorithm's usual assumptions still hold, again. The odds of this are ((256 - B) / 256) * ((B - min(C + 1, B - S)) / 256). That means this is a likelier outcome the lower the catch rate is.
- We have to reroll R1 once, and then the second R1 does fall within the capture rate window (the odds of this are ((256 - B) / 256) * (min(C + 1, B - S) / 256), meaning this outcome is likelier the higher the catch rate is, up to B - S). Our final R1 is evenly randomly distributed, but the R2 that we generate next will not be. This will actually have no effect if the HP factor F has been maxed out (that is, if the Pokémon is below 1/3 health or 1/2 with a Great Ball), since then the actual value of R2 won't matter anyway; the role of R2 in the algorithm is that you catch the Pokémon if it's less than or equal to F, which will always be the case anyway if F is 255. But otherwise, the algorithm will not necessarily give the expected results - in some real-world cases, it's flat-out impossible for R2 to be less than or equal to F, even though normally this should always be at least roughly a 1/3 chance!
- We have to reroll R1 at least twice, the chance of which is ((256 - B) / 256) * ((256 - B) / 256). By this point, the actual R1 that we end up with won't be genuinely random, nor will the subsequent R2 if any - the result might be biased even if the HP factor is maxed out.
We can visualize when these four scenarios will happen like this, where a1 and a2 are the first two R1 rolls:
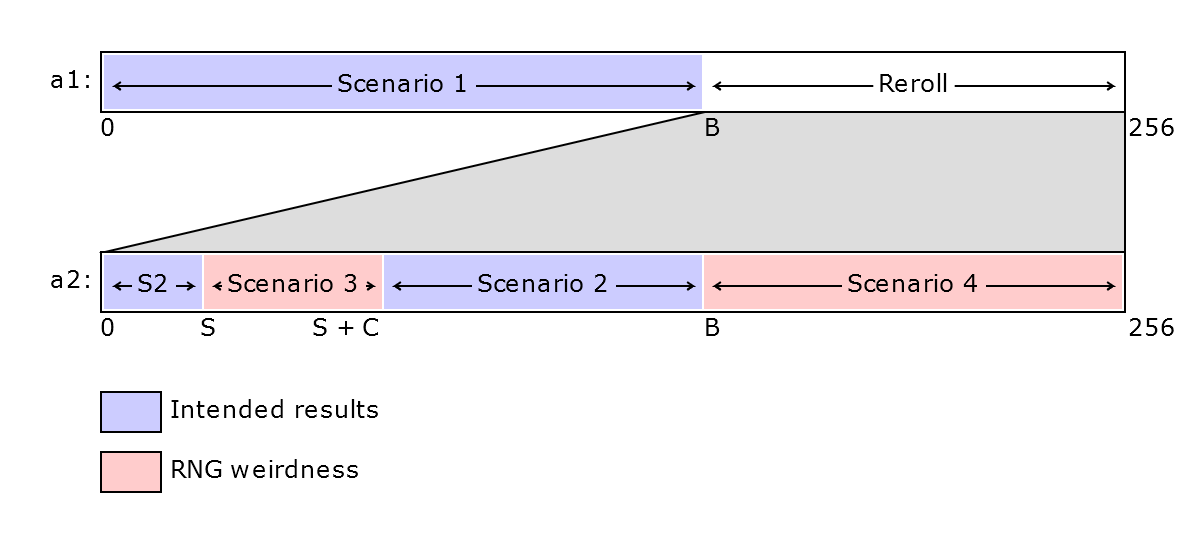
Scenarios 1 and 2 work as intended; scenarios 3 and 4 lead to strange, nonrandom results.
So How Much Does This Matter?
So exactly how are the capture algorithm's random numbers going to be related to each other, in scenarios three and four? The precise number of processor cycles that pass between RNG calls during the capture algorithm is unfortunately a bit complicated and depends on the ball, status, exact max and current HP, and even whether you're playing Red/Blue or Yellow - but the practical upshot is that every time we reroll R1, the rDiv value will have increased by either 2 or 3 since the last roll, and the carry bit will always be set to 1. Meanwhile, by the time we generate an R2 value (if we do), rDiv will have been incremented further by some number between 89 and 100 depending on the exact parameters, and the carry bit will be 0.* If you really want to know, the cycle count between R1 rerolls is 520 if the previous roll was greater than 200 and 564 if it's greater than 150, minus 4 if you're playing Yellow; between the final R1 and R2, it's 22308 cycles, plus 48 if it's a Great Ball or 60 if it's an Ultra/Safari Ball, plus 48 if the Pokémon is poisoned/burned/paralyzed or 52 if it's asleep or frozen, plus 144 times the combined number of 1 bits in the results of the two divisions performed in the HP factor calculation, plus 152 if you're playing Yellow, minus 4 if the current HP is less than 4, plus 60 if the HP factor as initially calculated is greater than 255 and needs to be capped. Told you it was a bit complicated.
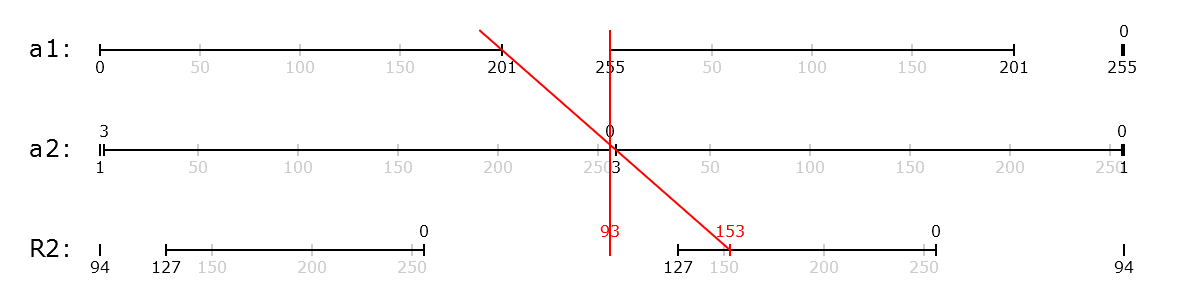
This can have pretty drastic effects, especially for Ultra Balls in particular. To show why, let's take a real-world example. Suppose we want to catch a level 70 Mewtwo with 238 max HP at full health in an Ultra Ball in Red/Blue, and our first R1 is some number higher than 150. We generate another, which turns out to fall into the capture rate window (so this is scenario three above). Let's call these numbers a1 and a2. We now know two things: a1 > 150, and 0 <= a2 <= 3 (because Mewtwo's capture rate is 3, and the capture rate window is thus 0–3 when there is no status in play). But this tells us that at the moment a2 was generated, the current value of rDiv must have been somewhere in the range 0–107 - if it were anything higher than that, then there's no way we could have a1 > 150 and a2 being 0–3. By the time we generate our R2, rDiv will then have been incremented again - in this case, by exactly 93 - so by then rDiv will be somewhere between 93 and 200. And since a2 is between 0 and 3, and the carry bit is always 0 when we generate R2, this means our R2 value will inevitably turn out to be between 93 and 203.
Which is bad, because if this Mewtwo is at full health, its HP factor F will be 85, and we can only catch it if R2 is less than or equal to F! We've just proven that thanks to the RNG mechanics, if we've gotten to this stage it can't be. We can visualize the problem here as trying to fit a straight line through a series of gaps on three number lines, where each number line stands for a generated random number, loops back to 0 at 256, and is shifted to account for the carry bit and the way rDiv changes:
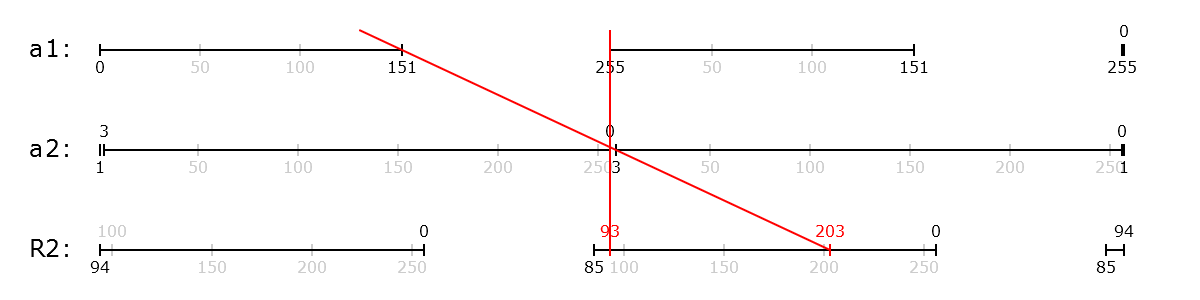
Here, the only possible R2 values we can end up with are those between the two red notches on the bottom line - the lowest possible value we could get, if a1 is 255 and rDiv is 0* in which case a2 rolls over to 0 because of the carry bit and R2 then ends up at 93, and the highest possible value we could get, if a1 is 151 and rDiv is 107* in which case a2 = 151 + 107 + 1 = 259 which rolls over to 3, and then R2 ends up at 203. If you imagine taking one of the straight red lines and trying to wiggle it around so that it ends up somewhere lower than 93 or higher than 203 on the R2 line, while still going through the gaps in the a1 and a2 lines, it's clearly impossible. The R2 values where we actually catch this Mewtwo, however, as represented by the gap from 0–85 on the bottom line, don't overlap with that range at all! We can never draw a straight line passing through the gaps in the a1, a2 and R2 lines - in other words, there is no way to catch this Mewtwo if we had to reroll R1. If there were more rerolls of R1, this would only constrain the possible R2 values further:
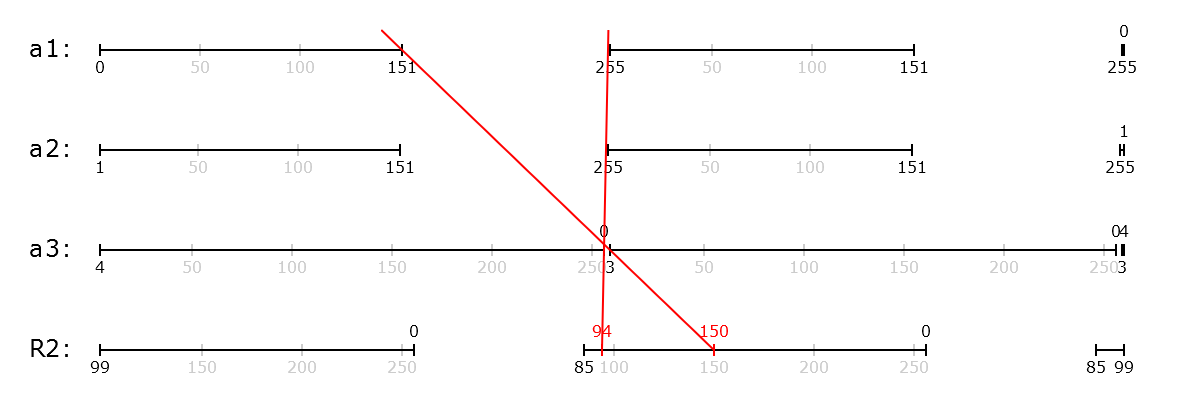
Thus, the only way to catch that full-health Mewtwo in an Ultra Ball is if the first generated R1 was less than or equal to 150, and we don't have to reroll at all. This effectively means that an Ultra Ball is exactly equivalent to a Poké Ball in this case - the only difference between a Poké Ball and an Ultra Ball, after all, is the rerolling! There is no reason to buy Ultra Balls for it at all, if we're going to try to catch it at full health. Most cases aren't quite this drastic - you're merely getting less out of the Ultra Ball than you would be otherwise - but it can still be quite significant, thanks to the fact that the addition of 89–100 to R2 will always mean shifting the start of the possible R2 window up past 85. The only way to be able to capture the Pokémon after a reroll is if the highest possible R2 loops around past 256, as in this example of a Pokémon with a catch rate of 45, such as Tauros or Scyther:
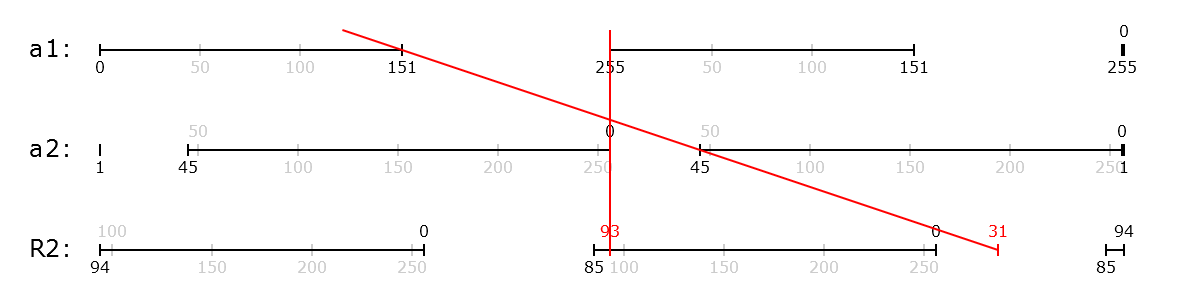
Here, we can end up with the values from 0 to 31, if the initial a1 roll was quite low and rDiv quite high, which makes capture possible.
What if we'd been using a Great Ball? Then a1 > 200 and and 0 <= a2 <= 3, meaning rDiv must be in the range 0–57, and when we generate R2 it will have increased to something between 89 and 157 - a significantly narrower possible range than for the Ultra Ball. However, since the HP factor F is closer to 127 for a full-health Pokémon with a Great Ball, odds are actually better than even that R2 will be less than or equal to F! The RNG weirdness actually improves our chances a bit in this case over the intended chance:
All in all, this is why the RNG design can drastically change what outcomes are possible or feasible after rerolling - both positively and negatively. The chance that we don't have to reroll anything is still there, so capture never becomes outright impossible thanks to the RNG, but it can really mess with the outcomes once rerolls start happening - and for an Ultra or Safari Ball, we do at least one reroll more than 41% of the time, while for a Great Ball we do them more than 21% of the time.
Visualizing the RNG
The graphs above, while illustrative for how the RNG can mess with what's possible, don't really tell the full story, since the odds of each number within the possible ranges aren't evenly distributed; they can tell us whether certain outcomes are possible, but not at a glance how likely they are. To visualize our actual odds of capture in any given situation, we can turn to another way of picturing how the RNG works.
The image below, which I'll call an RNG map, illustrates your chances of capturing a hypothetical sleeping Scyther with 100/100 HP in an Ultra Ball (this might for instance be a level 35 one with an HP IV of 9). Each pixel in the image shows the result of the capture attempt, given the pixel's x coordinate within the image stands for the value of rDiv at the time the first random number is generated, and the y coordinate (with 0 at the top) stands for the value of that first random number. They're colored depending on the final outcome: the more cyanish green is capture within the status window; the more lime green is capture within the catch rate window; the orange is failed capture within the catch rate window; the red is failed capture in the auto-failure window; and the luminosity (lightness) of each pixel shows the number of rerolls of R1, with lighter pixels indicating a greater number of rerolls. As you can see, coloring the map in this way produces some pretty interesting patterns!* Note that the map coloring is slightly simplified, as it assumes rDiv is 128 processor cycles - the average - away from being incremented again at the time the first random number is generated, rather than taking all possibilities into account. In practice, the potential effect that this could have on the results is very small - only a few pixels would change. Imagine the lime green areas may shift one pixel left or right, some pixels on the border between red and white in the bottom right may flip, and the orange noise between the green beams on the lower left side shifts just a little - the overall visual of the map remains the same.
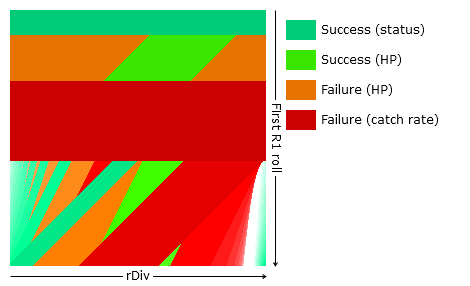
We can genuinely assume that both the first random roll and rDiv are evenly randomly distributed at the time we throw our ball, in any regular gameplay situation - so we've got equal odds of being anywhere in this image. Hence, the total green area as a proportion of the total area of the image represents our total chance of capturing the Pokémon. In this case, that's 19646 out of 65536 pixels, or just about 30% - not bad!
So what on earth's going on here? What are these patterns? To understand better what this image means, let's go over what's actually happening in it.
The top part of the image consists of some neat, orderly horizontal blocks. Appropriately enough, this is scenario 1, where we don't have to reroll R1 at all and the RNG behaves exactly as expected! Since the y axis stands for the value of the first random number, it's easy to see where that comes from - if it's 0-24, then it's within the status window and you catch the Pokémon, regardless of rDiv; if it's 25-70, then it's within the capture rate window, and exactly 86 of the possible rDiv values for each of those possibilities will net you an R2 <= F; if it's 71-150, it's an auto-failure by virtue of being outside the capture rate window... and then if it's 151 or more, we're going to reroll and start getting RNG chaos, resulting in the mess below.
Here's the area of the map where we reroll R1 exactly once, highlighted:

This is actually just kind of a repeat of the strip above, in general structure, only laid out diagonally - first you have the status auto-capture window, then the capture rate window, then the auto-failure window. This is because the initial rolls in this area will on the reroll end up in a corresponding place on the top strip - for example, when the initial roll is 151 and rDiv is 102, the top-left-most pixel of this strip, rDiv will be incremented to 104, and with the carry bit of 1, that's just enough to make the next R1 roll end up at 0, in the status window. The split between orange and lime green within the capture rate window, however, looks pretty different from the top strip - which makes sense, because that's when the weirdness begins: recall, a single reroll gives us scenario 2, still genuinely unbiased, unless we land within the capture rate window, in which case we will get a biased R2.
This is where we have exactly two rerolls:

Suddenly things are looking pretty far off how those orderly strips at the top look, aren't they? This is essentially a single strip at a steeper angle than the previous two, which wraps around to the bottom when it reaches the top - but you can only see a small part of the strip because the previous two are in the way! There's only a tiny lime green triangle representing success within the capture rate window this time around. These areas of the map are where the initial R1 and rDiv combination land our next roll in the 1-reroll strip, as shown above, resulting in one more reroll to land in the top strip.
And things only get more obstructed from there. This is three rerolls:

There's no lime green at all here; we just have that reliable status beam on the left (which admittedly wraps around a bit to the right side, if you notice the small status green notch in the bottom right corner), and then failures. In fact, that's the case for every subsequent number of rerolls: there isn't any more lime green on the map. You can probably guess the pattern from here: each reroll forms a new strip on the left, angled a little further left, and a corresponding strip of red on the right side. The green-white area on the right side is kind of a continuation of these beams, as you can see if you lay two maps side by side:

What's happening in that bottom right area is that if you start with a sufficiently high rDiv value, the next roll will be a bit lower than the previous (adding 255 when everything rolls over at 256, after all, has the same effect as subtracting 1), but since rDiv ticks upward on the rerolls, we'll then reverse course, with the rolls getting higher again until we surpass 255. Sometimes that just means we spend a couple rolls dancing right on the edge, but with the right starting conditions, you can get into a pretty long reroll loop under those circumstances. For example, in one of the white pixels furthest left near the bottom of that area, for initial R1 roll 254 and rDiv 233, we end up rerolling twenty whole times: after the initial roll of 254, we get 234, 216, 200, 186, 175, 166, 159, 154, 151, 151, 153, 157, 163, 171, 182, 195, 210, 227, 246, and then finally 11 - we just barely lick the border of 151 in the middle before the numbers start to rise again. The pixel right below it, for initial R1 255 and rDiv 233, actually reaches escape velocity: 255, 235, 217, 201, 187, 175, 166, 159, 154, 151, 150, at which point it's landed in the red auto-failure window and we stop rolling.* The reason it does here, despite starting with a higher R1, is that the earlier progression ends up advancing rDiv a bit earlier thanks to landing on 200 rather than 201, which thanks to how the rerolling works takes more clock cycles - this'd be different if we made different starting assumptions about how far we are from incrementing rDiv at the start. The end result of this sort of progression, if it does turn around and start increasing again, is always a quite low number, by the nature of it (the highest it can go is twenty), hence why that area is all within the status window here.
As you may be able to guess from the RNG map visualization, each successive reroll strip is likelier and likelier to end up within the status window; after all, the status window takes up the leftmost area of each strip, and increasingly that's the part that's visible. In fact, the status window here altogether accounts for 13836 out of 65536 pixels on the map, or 21.112%, with the lime green adding a mere 5810, or 8.865%. For comparison, theoretically, with an unbiased RNG, using an Ultra Ball on a sleeping or frozen Pokémon should result in a 25/151 = 16.556% chance of landing within the status window, and for a Great Ball it should be a 25/201 = 12.438%, but thanks to the way the RNG actually works, it's significantly more than that. In fact, the status window will take up the same areas of the map regardless of the Pokémon's catch rate or HP; being asleep or frozen will always provide a baseline chance of about 21.11% for an Ultra Ball, or 14.52% with a Great Ball.
What if Scyther were paralyzed rather than asleep? This would leave the status window narrower (12 pixels rather than 25), and shift the capture rate window up accordingly, while leaving the total width of the strip the same:

Theoretically, with a perfect RNG, the lesser status conditions should give a baseline 12/151 = 7.947% chance of capturing the Pokémon with an Ultra Ball or a 12/201 = 5.970% with a Great Ball, less than half of the greater status conditions; in reality, they add a more substantial 11.07% with an Ultra Ball or 7.62% with a Great Ball, a little more than half of the actual values for the greater statuses.
The split between orange and green within the capture rate window is actually fixed for a given ball and HP factor F: the checks for the status auto-capture and the capture rate auto-failure only screen off certain outcomes from ever getting as far as doing the HP factor check. If we were trying to catch a full-health Pokémon with a catch rate of 255 (or any other catch rate greater than or equal to 151, the B value), the map would look like this:

This reveals that a full-health Pokémon with no status can never be caught on or after the third reroll - it's not just our Scyther. However, lowering the Pokémon's HP to raise the HP factor F will expand all those green stripes rightward and start some green blooming in the bottom corners, until once you're down past 1/3 of its maximum HP the entire map is green.
Since the status and auto-failure windows screen off different parts of each reroll strip, and the green isn't evenly distributed across the orange areas, this creates RNG bias - as with how we just saw that for our Scyther, with a lesser status condition there was not only less of the status window but also much less lime green left than when it was asleep or frozen. This is simply because the capture rate window shifted further left, even though theoretically status shouldn't be affecting the HP factor check. With no status at all, it shifts even more and there's only a small green triangle left in the one-reroll area:

A full third of the orange there ought to be green, but obviously isn't. This is unfortunately what the graph looks like when you try to catch a Scyther, Pinsir, Tauros, Tangela or Kangaskhan in the Safari Zone, unless you throw rocks - which you shouldn't. If you've ever cursed how hard they are to catch, you truly can blame the RNG! Chansey, with a catch rate of 30, and Dragonair in Yellow, with a catch rate of 27, are even worse:


So you weren't imagining things - all along, the difficult-to-catch Pokémon in the Safari Zone really were exceptionally difficult to catch, significantly more so than planned!
In general, at more than half health Ultra Balls underperform compared to what they should do - even to the point that they can be worse than a regular Poké Ball for a full-health high-catch-rate Pokémon! You have a 27.909% chance of capturing a level 30 full-health Magikarp in an Ultra Ball, but a 34.302% chance with a Poké Ball. However, once the Pokémon is down past half health or so, the Ultra Ball catches up with where it should be, and in fact is just a tiny bit better than it would be with a perfect RNG.
Great Balls also underperform ever so slightly compared to how they should do theoretically at higher HP - however, the difference is much smaller (48.69% compared to a theoretical 50%), and of course, Great Balls have a head start on Ultra Balls thanks to their higher initial HP factor of 127 - here's what the high-catch-rate map looks like for a Great Ball at full HP:

This chart illustrates theoretical vs. actual ball performance for both Great and Ultra Balls for a high-catch-rate Pokémon, plotted against current HP, demonstrating how the RNG skew is slight for the most part aside from how the Ultra Ball line goes below the Poké Ball line at high HP. Note that actual and theoretical performance for Poké Balls matches the theoretical Ultra Ball performance in the high catch rate case:
However, when dealing with lower catch rates, with more of each strip obscured by the auto-failure window (especially lower than 75 or so), the RNG bias can have a significantly bigger influence; Great Balls will overperform somewhat significantly throughout, more so as you lower HP, and while Ultra Balls underperform significantly at high HP, at about two thirds health they cross over into overperforming, even more so than Great Balls! All in all, RNG bias makes lowering the Pokémon's HP far more significant than it was meant to be: while the catch rate for a Great Ball is meant to be doubled at less than half HP, it's a bit more than doubled, and for an Ultra Ball in this example the catch rate is more than five times higher at low HP than at full HP, where it should have been three times. Great Balls remain significantly better at full health, but Ultra Balls overshoot them by a lot once you're down to low HP:
RNG Map Generator
With this calculator, unlike the regular R/B/Y Catch Rate Calculator, you can generate RNG maps like the above for any situation you like! Play around with it to get a feel for how different parameters affect the results.
Page last modified November 20 2025 at 17:02 UTC
Post comment
Inflammatory or off-topic comments will be deleted; please go to the guestbook for discussion unrelated to this page. You can use BBCode (forum code) to format your messages.
Giving an e-mail address is optional; if it is given, you will be notified by e-mail if I respond to your post. If you fill in a website (this should be your own website, blog or social media profile), it will be linked publicly on your post.
- [b]Bold[/b]
- [i]Italic[/i]
- [u]Underlined[/u]
- [s]Strikethrough[/s]
- [url=http://www.dragonflycave.com]Link[/url]
- [spoiler]Spoiler[/spoiler]
Comments
No comments on this page as of yet.